Create various graphs based on information provided
Create various graphs based on information provided
Vote: (74 votes)
Program license: Free
Developer: Padowan
Version: 4.4.2
Works under: Windows
Vote:
Program license
(74 votes)
Free
Developer
Version
Padowan
4.4.2
Works under:
Windows
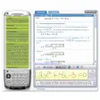
Graph is a versatile mathematical application designed to conveniently visualize mathematical equations and functions, primarily catered to students, teachers, and professionals in scientific and engineering fields. This software seamlessly plots both simple and complex graphs, offering robust features to aid in analytical and educational pursuits.
User Interface and Customization
The user interface of Graph is straightforward, allowing for simple navigation and utilization of its features. Users can benefit from the ability to scale the user interface, ensuring that the application remains legible and user-friendly across different screen resolutions and sizes. Additionally, the software enables the customization of save as image options, which allows for consistent export settings tailored to the user's recurrent needs.
Feature-Rich Graphing Tools
Graph boasts a comprehensive suite of features to create detailed graphs. One of its most notable features is the ability to animate the manipulation of constants, offering a visual representation of how changes in variables affect the graphed functions. This is particularly useful for teaching and presenting complex concepts in a classroom setting or during presentations.
The software supports full Unicode characters, which means that under Windows 2000/XP, users can enjoy expanded text options and flexibility in labeling. The character map's support for traditional Chinese, Mongolian, Swedish, and Polish expands the software's usefulness across various languages, making it a more versatile tool globally.
Furthermore, Graph provides enhanced labeling capabilities with a feature that allows text labels to be displayed vertically. Users can also specify the interception with the y-axis directly for built-in trendlines, adding to the precision and customization of graph analysis.
Functionality and Convenience
In terms of functionality, Graph has streamlined the process of working with mathematical functions. The renaming of the Euler beta function from 'B' to 'Beta' frees up 'B' for use as a custom constant, reflecting the software's dedication to user convenience and flexibility.
Graph's ability to plot a wide range of functions, including standard, parameter, and polar equations, is laudable. It also handles inequalities, enabling users to shade regions of the graph to represent solution sets, which is highly valuable for educational purposes and problem-solving.
Overall Performance
Performance-wise, Graph operates smoothly without placing excessive demands on system resources. It can manage multiple graphs simultaneously and offers a stable environment for users to work on complex equations without concerns for crashes or significant slowdowns.
Pros
- Intuitive and scaling user interface
- Ability to create animations demonstrating dynamic changes in variables
- Full Unicode character support under Windows 2000/XP
- Vertical text labeling and precise trendline interaction settings
- Support for multiple languages
- Robust plotting capabilities for various function types and inequalities
Cons
- Limited documentation could make it challenging for new users to access advanced features
- Visual elements may seem dated compared to contemporary graphing tools
- Some features are restricted to specific versions of Windows
In conclusion, Graph represents a solid choice for those in search of a reliable, multifaceted graphing tool. Its advantages in customization, feature-rich graphing capability, and stable performance make it a standout option within its software category. Despite minor limitations with regards to design aesthetics and accessibility for newcomers, Graph is a robust application that fulfills the needs of a wide spectrum of users involved in mathematical and scientific visualization.